Particle count and ICP metals tests measure different aspects of fluid contamination, so their results often don’t match. The particle count focuses on physical debris and particle size, giving immediate clues about contamination and potential equipment wear. ICP metals testing, however, detects dissolved metals and chemical wear indicators that develop over time. Because each test targets unique contamination signs, understanding their differences helps you interpret fluid health more accurately—there’s more to uncover if you explore further.
Key Takeaways
- Particle count detects physical debris size and quantity, while ICP measures chemical metal concentrations, leading to different contamination insights.
- Physical particles may be present without elevated metal levels, causing discrepancies between the two tests.
- ICP identifies dissolved or wear-related metals, which might not correlate with visible particles detected in particle count analysis.
- Large debris may not be chemically active or dissolved, making ICP less sensitive to certain physical contaminants.
- Combining both tests provides a comprehensive understanding of fluid health, as each assesses different contamination aspects.
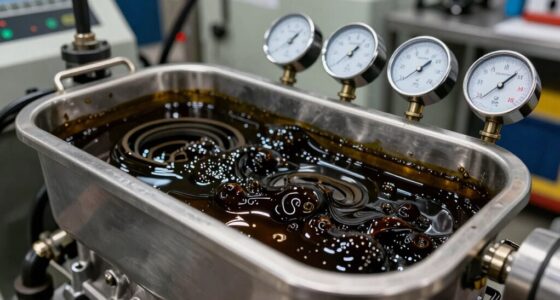
When evaluating contamination levels or ensuring fluid purity, understanding the differences between particle count analysis and ICP metals testing is essential. These two methods serve distinct purposes and rely on different principles, which can lead to discrepancies in their results. Particle count analysis focuses on measuring the number and size of particles suspended in a fluid, offering a direct look at physical contamination. It’s highly sensitive to particle size, detecting even tiny particles that could cause equipment wear or failure. Detection sensitivity in particle count methods is calibrated to specific size ranges, making it possible to identify particles as small as a few microns. This allows you to assess particulate contamination quickly and visually, which is particularly useful in industries like hydraulics or lubrication where physical debris can be immediately problematic.
Particle count analysis detects physical debris, focusing on size and number, vital for immediate contamination assessment.
On the other hand, ICP (Inductively Coupled Plasma) metals testing analyzes the chemical composition of the fluid at a molecular level. It detects dissolved metals and metal particles that are often too small or chemically integrated into the fluid matrix to be seen through physical particle counting. ICP’s detection sensitivity is incredibly high when it comes to trace metals, capable of identifying parts-per-trillion levels. However, it doesn’t directly measure particle size. Instead, it provides insights into the presence and concentration of specific metals, which could originate from corrosion, wear, or contamination from external sources. Because ICP tests focus on dissolved elements, they might miss larger particles that haven’t fully dissolved or are physically present but chemically inert.
The key reason these tests don’t always agree is that they measure fundamentally different aspects of contamination. Particle count analysis captures the physical debris that could cause immediate mechanical issues, while ICP metals testing reveals chemical contamination, which might indicate long-term wear or corrosion processes. For example, a fluid could have a high particle count with many small particles, but if those particles aren’t metal-based, ICP testing might show low metal levels. Conversely, ICP could detect rising metal concentrations without a corresponding increase in physical particles, suggesting chemical contamination or early stages of corrosion not yet manifesting as debris. Additionally, incorporating advanced testing techniques can enhance your understanding of fluid health by providing a more detailed analysis.
Understanding these differences helps you interpret results correctly. If your priority is preventing mechanical failure due to physical debris, particle count analysis is more relevant. If you’re monitoring for chemical corrosion or metal wear, ICP metals testing provides more precise insights. Both tests are valuable, but recognizing their limitations and what they reveal ensures you get a complete picture of fluid health. Combining these methods offers a comprehensive approach, helping you make better maintenance decisions and avoid costly equipment failures.

FPC-P2 Portable Oil Particle Counter 0.8-600μm – On-Site Purity Testing of Hydraulic Fluids, Lubricants, Turbine Oils
- Testing Principle: Photoresistance (shading) method
- Sensor Type: High-precision laser sensor
- Test Range: 0.8-600μm
As an affiliate, we earn on qualifying purchases.
As an affiliate, we earn on qualifying purchases.
Frequently Asked Questions
How Do Particle Size Ranges Affect Test Results?
Particle size ranges considerably impact your test results because they influence measurement accuracy. If the size range is too broad, smaller particles may be overlooked, leading to underestimates. Conversely, narrow ranges improve precision, but can also miss larger particles if not properly calibrated. You need to select appropriate particle size ranges to guarantee your tests accurately reflect the actual particle distribution, ultimately giving you reliable data for decision-making.
Can Sample Contamination Influence Measurement Discrepancies?
Contamination sources in your sample are like weeds choking a garden—they can skew your results. Yes, sample contamination can cause measurement discrepancies, even with strict lab procedures. Contaminants may come from equipment, environment, or handling, making it harder to get accurate readings. To minimize this, follow rigorous lab procedures, use clean tools, and control the environment, ensuring your measurements truly reflect your sample’s composition.
What Are the Limitations of Particle Counting Methods?
Particle detection methods have limitations that affect measurement accuracy. They often struggle with distinguishing between different particle types and sizes, leading to potential inaccuracies. Small particles may go undetected, and high particle concentrations can cause counting errors. Additionally, these methods can be influenced by sample contamination and environmental factors, which further hinder precise results. Understanding these limitations helps you interpret particle count data more effectively and recognize when additional testing might be necessary.
How Does Sample Preparation Impact ICP Metal Analysis?
You might think sample preparation doesn’t matter, but it’s essential for ICP metal analysis. Proper sample homogenization ensures even distribution of metals, preventing skewed results. Using reagent purity is equally important; impurities can introduce errors, making your measurements unreliable. Skipping these steps can lead to inaccurate readings, so always homogenize samples thoroughly and choose high-purity reagents to guarantee precise, consistent ICP metal analysis results.
Are There Industry Standards for Comparing These Tests?
Yes, industry standards and calibration protocols guide the comparison of particle count and ICP metal tests. You should follow established procedures from organizations like ASTM or ISO to guarantee accuracy and consistency. These standards specify calibration methods, sample handling, and quality control measures, helping you interpret results correctly. Adhering to these protocols minimizes discrepancies and ensures your test data aligns with accepted industry practices.

Sacred Sampling Heavy Metals Water Test Kit — Laboratory Analysis for Heavy Metals | Mail-in Drinking Water Sample Collection Kit | Accredited & Certified ICP-MS Laboratory Result
- Complete Professional Testing Kit: Includes sample bottles, guide, and shipping label
- Tests for 13 Heavy Metals: Measures aluminum, arsenic, barium, and more
- EPA Method 200.8 ICP-MS Analysis: Detects metals at parts-per-trillion levels
As an affiliate, we earn on qualifying purchases.
As an affiliate, we earn on qualifying purchases.
Conclusion
Think of particle count and ICP metals like counting stars versus measuring water in a glass—you might get different stories. I once saw a filter with thousands of tiny particles but almost no metals detected, like a sky full of stars but empty skies. These tests serve different purposes, so don’t be surprised if they don’t match up. Just remember, each gives you a piece of the puzzle, but neither alone tells the whole story.

Transmission Fluid Tester Kit Gasoline & Diesel Gearbox Oil Diagnostic Tool High-Precision Diagnostic Analysis Tool with 31.5in Probe Transmittance/Temperature Testing, 2.8in Display (4 Batteries)
- Advanced optical transmission oil probe: Measures light transmittance for wear detection
- High-precision temperature sensor: Provides accurate oil temperature readings (-10°C to 125°C)
- Universal gasoline and diesel analysis: Diagnoses degradation and additive depletion in various oils
As an affiliate, we earn on qualifying purchases.
As an affiliate, we earn on qualifying purchases.

Infrared People Counter, Bidirectional Door Traffic Counter with App
- Bidirectional Counting: Tracks entries and exits accurately
- Easy Installation: Mounts in 3 minutes without tools
- Mobile App Monitoring: Access real-time data on your phone
As an affiliate, we earn on qualifying purchases.
As an affiliate, we earn on qualifying purchases.