
A single used oil analysis gives you just a quick snapshot and can’t reveal ongoing issues or wear trends. Sampling frequency and quality greatly impact the accuracy of your results, and poor techniques can lead to misleading data. To truly understand your equipment’s condition, you need multiple tests over time to identify patterns and catch early signs of trouble. Keep exploring, and you’ll discover how trend analysis can improve your maintenance decisions.
Key Takeaways
- A single oil analysis provides only a snapshot, missing trends or early signs of wear.
- It lacks historical data, making it difficult to distinguish normal variations from emerging issues.
- Test results can be affected by sampling timing, technique, and sample handling, impacting accuracy.
- Trend analysis over multiple samples reveals wear patterns and contamination buildup more reliably.
- Proper interpretation requires understanding equipment history and operational context beyond isolated test results.

LockNLube Mini Grease Gun Kit. Includes Our Patented Grease Coupler (Locks on, Stays on, Won't Leak!) Plus a 12 Hose and in-line Hose Swivel.
LockNLube Grease Coupler
As an affiliate, we earn on qualifying purchases.
Why a Single Oil Analysis Isn’t Enough to Diagnose Equipment Issues
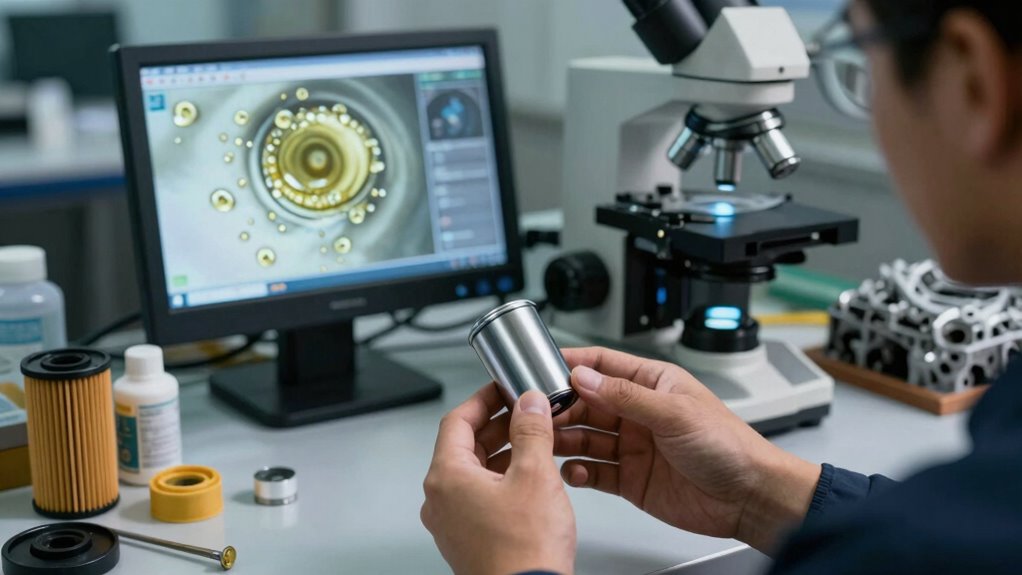
A single oil analysis provides only a snapshot of the equipment’s condition at one moment in time, making it insufficient for accurate diagnosis. It offers limited data—typically 20 to 40 measurements—that can’t reveal trends or evolving issues. Without historical context, you can’t determine if wear debris, contamination, or additive levels are improving or worsening. Factors like particle settling, operational variations, and maintenance history influence the results, so one sample can be misleading. Relying solely on a one-time report risks missing early signs of failure or misinterpreting the equipment’s health. Effective diagnosis requires multiple samples collected over time, enabling trend analysis that uncovers patterns and provides a clearer picture of ongoing wear and potential problems.

Frantz Filter Universal Bypass Oil Filter Kit by Hot Shot's Secret
The Frantz Universal Oil Bypass Kit is a highly efficiency bypass filter; that can help increase engine life...
As an affiliate, we earn on qualifying purchases.
How Sampling Frequency and Quality Impact Oil Analysis Results
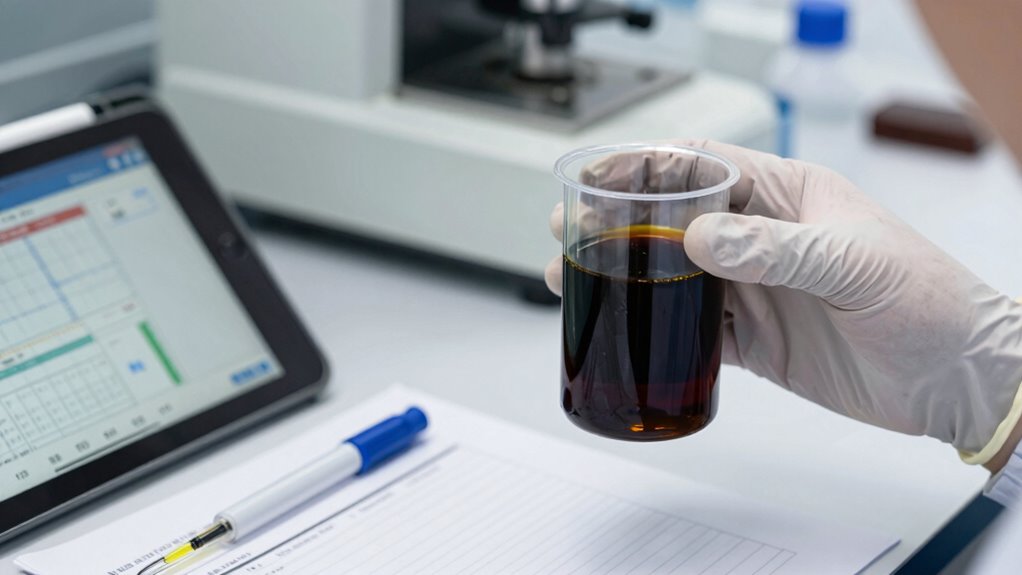
Sampling frequency and quality directly influence the reliability and interpretability of oil analysis results. If you don’t sample often enough, you risk missing trends or early signs of issues. Poor sampling quality can lead to unrepresentative data, skewing your analysis. To optimize results, consider these points:
- Sampling too infrequently can cause you to overlook emerging problems.
- Inconsistent sampling techniques introduce variability, reducing trend accuracy.
- Small or contaminated samples may not reflect the true system condition.
- Sampling timing relative to operational cycles impacts debris and wear particle visibility.
- Using proper DIY safety tips can help prevent contamination and ensure sample integrity.

Frantz Filter 5.9L & 6.7L Ram Diesel Truck Bypass Oil Filter Kit by Hot Shot's Secret
Increased Engine Life
As an affiliate, we earn on qualifying purchases.
What Factors Affect the Accuracy of Oil Test Data
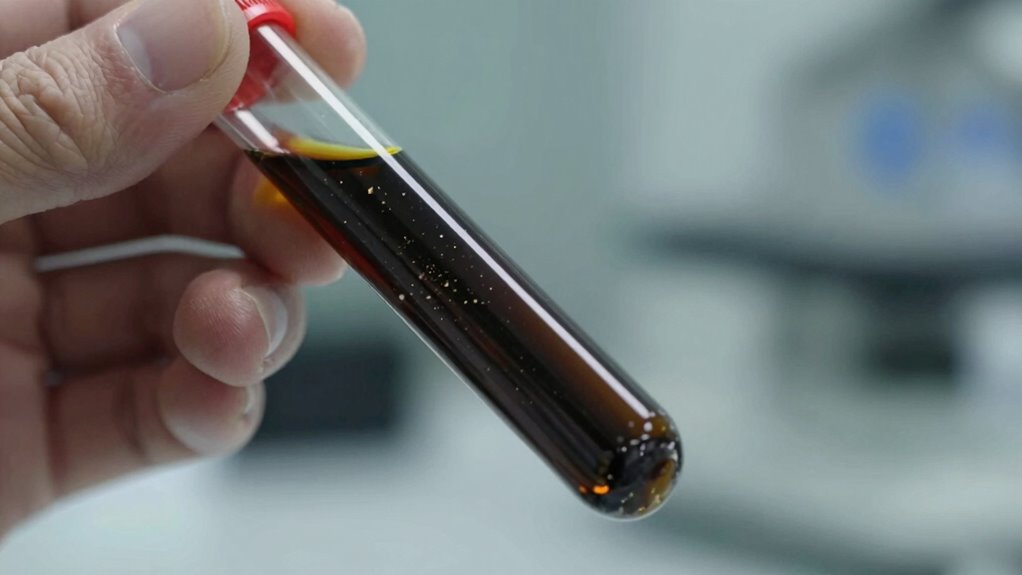
The accuracy of oil test data hinges on multiple interconnected factors that can distort or clarify the results. Sample collection timing, handling, and equipment history greatly influence data reliability. Variations in test methods across labs can cause inconsistent results. Factors like particle settling, sample volume, and contamination skew measurements. Additionally, test limits and interpretation depend on equipment type and operating conditions. Consider how different parameters interact:
| Factor | Impact |
|---|---|
| Sampling technique | Affects representativeness of debris and contaminants |
| Test method variation | Alters comparability across labs |
| Particle settling | Causes underestimation of debris in samples |
| Equipment history | Influences baseline and trend interpretation |
| Limit setting and interpretation | Risks misdiagnosis if thresholds are misapplied |
Furthermore, understanding measurement uncertainty helps contextualize the reliability of test results.

Frantz Bypass Filter Kit for 6.7 Liter Powerstroke Diesel Pickup Trucks by Hot Shot's Secret
6.7-liter Power Stroke bypass oil filter system increases engine life
As an affiliate, we earn on qualifying purchases.
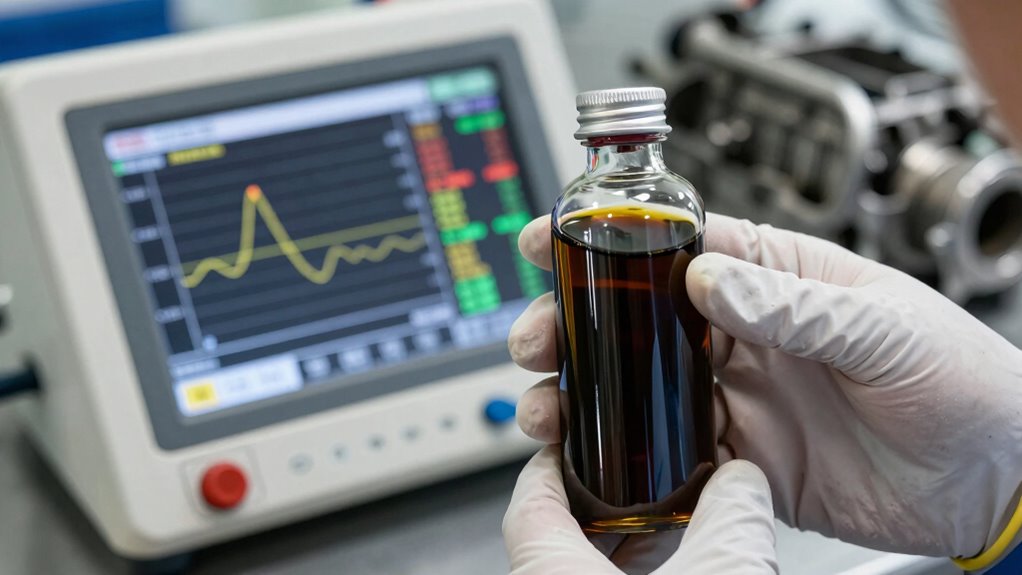
The Power of Trend Analysis: Tracking Oil Wear Debris Over Time
Tracking oil wear debris over time reveals patterns that single samples simply can’t show. By analyzing trends, you gain insight into equipment health, wear progression, and early warning signs. This visualization of data helps you avoid false alarms and missed issues. Consider these key points:
- Identify gradual wear increases that indicate developing problems before failure.
- Detect sudden debris spikes signaling immediate component damage.
- Correlate debris trends with operational changes like load or temperature shifts.
- Use historical data to set realistic, equipment-specific warning thresholds.
Trend analysis offers a dynamic view, enabling proactive maintenance decisions. It transforms isolated data points into actionable insights, reducing downtime and extending equipment life. When you track debris over time, you see the bigger picture, making your oil analysis far more effective.
Interpreting Oil Data Effectively for Better Maintenance Decisions
Interpreting oil data accurately is essential for making informed maintenance decisions that prevent equipment failures and optimize performance. Relying on a single sample isn’t enough; it offers limited insight without historical context. Trends over multiple samples reveal wear patterns, contamination buildup, and lubricant degradation, guiding better decisions. Be aware that samples taken minutes apart can vary markedly due to debris settling and stochastic wear debris distribution. Understand that lab reports often lack specific interpretive limits, so you need to consider equipment history, operational conditions, and maintenance practices. Combining trend analysis with knowledge of your machinery’s unique characteristics helps avoid misinterpretation. Using software tools and correlating data with operational metrics further enhances your ability to catch issues early, reducing downtime and extending equipment life. Additionally, understanding battery maintenance principles can improve your overall approach to machinery upkeep and data interpretation.
Frequently Asked Questions
How Do Operational Variations Influence Oil Analysis Results?
Operational variations considerably influence your oil analysis results by altering wear debris, contamination levels, and additive depletion. When your equipment operates under different loads, temperatures, or maintenance schedules, the oil’s condition fluctuates, making single reports unreliable. You need to take into account these variations, track trends over multiple samples, and understand how operational changes impact results to accurately assess equipment health and avoid misinterpretation.
What Role Does Equipment History Play in Interpreting Oil Data?
Imagine flipping through a photo album without context—your oil data is similar. Equipment history shapes your interpretation by revealing past maintenance, operating patterns, and wear trends, helping you distinguish between normal fluctuations and emerging issues. Without this background, you risk misjudging oil conditions, leading to unnecessary repairs or missed failures. Knowing your equipment’s history turns raw data into actionable insights, ensuring maintenance decisions are accurate and timely.
Can Different Lab Methods Produce Comparable Oil Analysis Results?
Yes, different lab methods can produce comparable oil analysis results, but only if the methods are standardized or well-calibrated against each other. You need to be cautious because variations in testing techniques, equipment sensitivity, and interpretation criteria can cause discrepancies. To guarantee accuracy, compare results from labs known for consistent, validated methodologies, and consider trend analysis over time rather than relying solely on single test outcomes.
How Can I Determine the Appropriate Warning Limits for My Equipment?
Imagine you’re steering by a star chart in an old ship; setting warning limits requires careful calibration. To determine the right thresholds, analyze trend data over time specific to your equipment, considering operational conditions and maintenance history. Use statistical and software tools to establish equipment-specific limits, not generic ones. Regularly review and adjust these limits as your data grows, ensuring you catch issues early without false alarms.
What Are the Best Practices for Selecting Representative Oil Samples?
You should follow best practices like sampling from the same, clean, representative location each time to avoid contamination. Use adequate sample sizes—around 100 ml—and guarantee proper sampling techniques to prevent particle settling or contamination. Collect samples at consistent intervals, ideally before scheduled maintenance, and consider sampling multiple points if possible. This consistency helps you get reliable data, track trends accurately, and make informed maintenance decisions.
Conclusion
Remember, a single oil analysis is like a snapshot—helpful but incomplete. To truly understand your equipment’s health, you need to track trends over time, much like watching a movie rather than just a single frame. Regular sampling and careful interpretation reveal the story behind your oil’s condition. By doing so, you’ll catch issues early and make smarter maintenance decisions, keeping your machinery running smoothly and avoiding costly surprises ahead.